The My Locations feature in My Connect allows you to upload attributes about geological locations you want saved in Connect. You can then filter by location(s) to view an editable attribute table, share a location with a colleague, navigate to a map with location risks flagged and details displayed about ratings for civil unrest, terrorism, war, and intelligence events, or navigate to the Location Analytics tool. Once your location(s) are saved, they become available on the Search page to view research documents about Country Risk Intelligence Events and in the Location Analytics tool for charting and manipulating risk data that can be saved and / or exported.
The My Locations filters are based on geographical locations and attributes you select and upload in an Excel template .csv location file. The format of the file allows you to upload up to four location group files. Each of those files can contain up to 10,000 locations and up to 12 attributes. For example, you may want to pinpoint all locations where you have refineries, or you may cluster several countries in a location group where you have other assets. Apply the location filters to a map to visually assess risks in an area and determine the radius around your location you want to cover. Edit the attributes for a location group in a table in My Connect / My Location or overwrite the attributes with a new upload. These are all quick and easy procedures in Connect.
The associated Location Analytics tool uses the location filters to chart risk information in Risk Exposure, Location Risk By Country, and Data View modules that contain charts, tables, and maps you can manipulate to view the data from several perspectives. Once you have filtered further with subgroups of your location data, you can create new location groups to further refine criteria. You may want to work with a single location group, or you may want to invoke comparison mode to compare two location groups to each other. You also have the choice of viewing civil unrest, terrorism, and war risks individually or in a combined format.
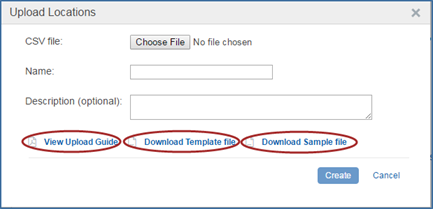
My Locations is also available on the Search page. The location groups you create are available for display and filtering of Intelligence Events in research documents. The uploading new location groups function is available on the Search page under in the left filters pane under Geography when you select Country Risk as the Sector as well as on My Connect / My Locations. The Upload Locations dialog box contains links to View Upload Guide, Download Template file, and Download Sample file. Uploading requires choosing an Excel .csv file you have compiled, and then selecting Create. An uploaded location group file is then automatically available on My Connect / My Location, the Map, and on the Search page.
Data is secure, uploaded through HTTPS mode and encrypted.
The following paragraphs explain how you can access My Locations and use specific functionality from the following content areas and tools in Connect.
My Connect / My Location allows you to manage your locations and provides an expanded table to edit information or add a location. From the main My Location page, you can delete a location, share a location, navigate to the map, learn about My Locations from a specific My Locations user guide, and navigate to the Location Analytics tool.
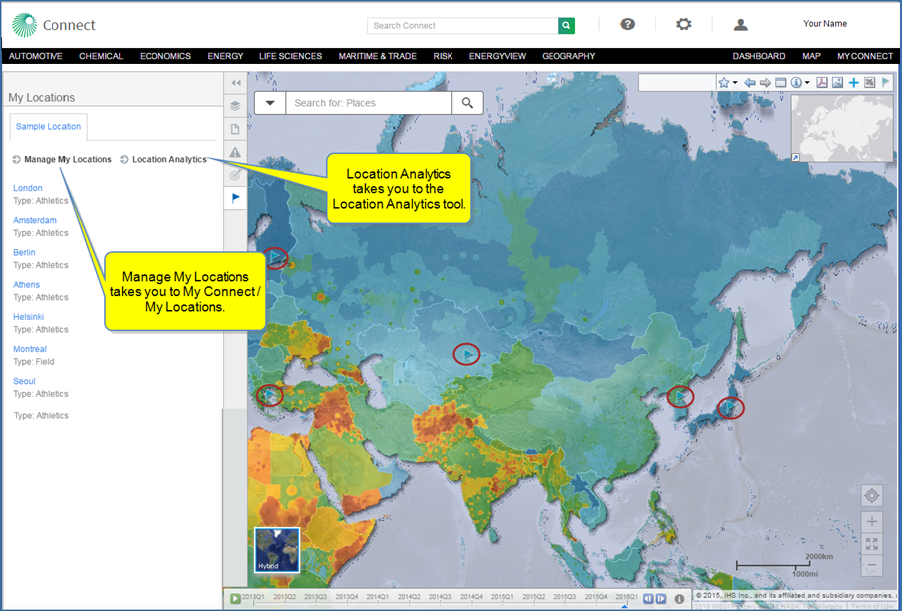
To navigate to My Locations through the My Connect menu, select Locations from the drop-down menu.

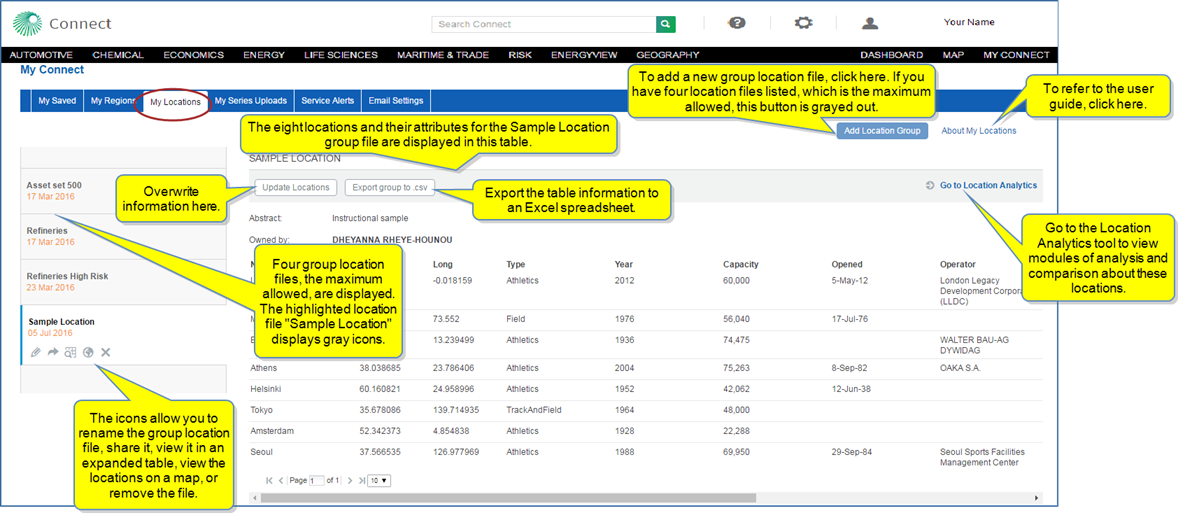
My Connect opens with My Locations displayed. The names of your location files—up to four—are listed in the left pane. In the example below, we'll be using "Sample Location." This is a group location name that contains eight locations and their attributes—Name, Lat, Long, Type, Year, Capacity, Opened, Operator, War, Terrorism, Civil Unrest, Combined. Under the name "Sample Location" is the creation date. The selected file also displays icons under the date that give you the option to change the location group name, share the location group, view an expanded table, view the locations on a map, or remove the location group. When you share a location group with a colleague, the colleague receives an email advising of the share.
Note: You can update by overwriting the selected location file. Select Update Locations. Review the caution: "Caution: Uploading a new file will overwrite the location data in this Location group."
You can export the information in the table to an Excel spreadsheet .csv file, and you can move to the Location Analytics tool by selecting the  link. (You must be a subscriber to Location Analytics to use the tool.)
The functionality to upload a new location group is available when you select Add Location Group.
About My Locations takes you to the My Locations help guide.
When you select the expanded table icon  , you are able to edit the table or add a location. Select Enable Editing.
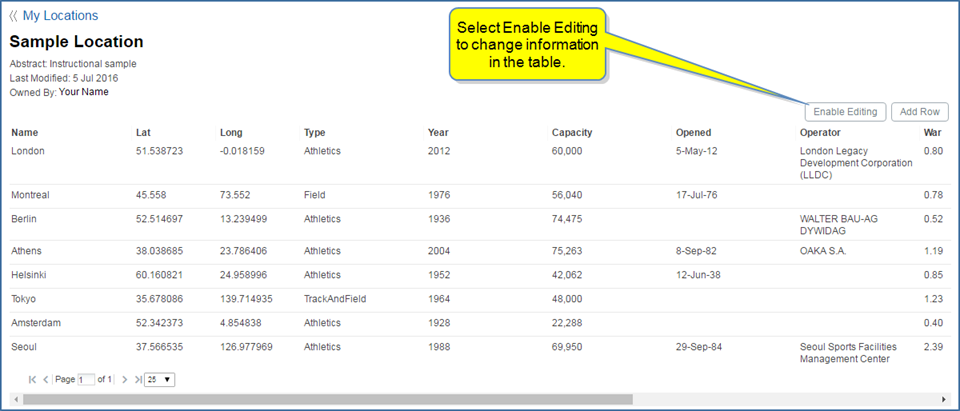
Edit buttons are displayed for each row. When you select an Edit button, the fields available for editing in the row appear as rectangles, and Save and Cancel buttons are available. When editing is complete, select Disable Editing to return to a static table.

When you select Add Location, a new row becomes available. You can enter the attributes for the new location and Save. A Cancel button is also available to delete the row.

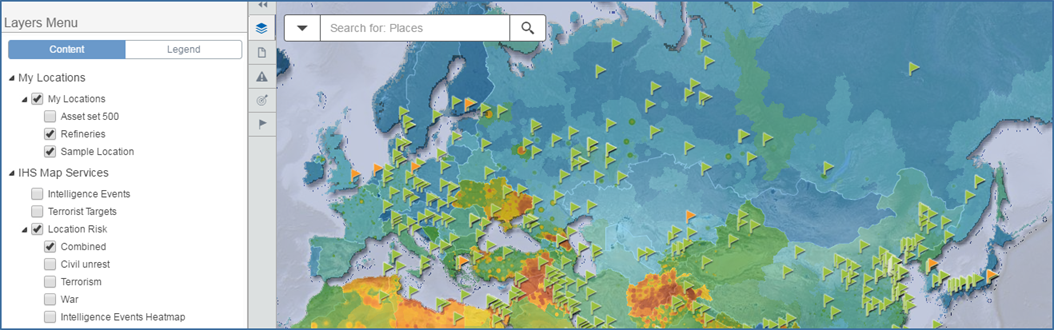
Once you have a location uploaded into Connect, you can view location risks on the Map that correspond with the geographic locations listed in your file. Menus for Layers, Research and Analysis, Intelligence Events, Terrorist Targets, and My Locations are displayed to the left of the Map in the Open Action Panel. If you select My Locations > Sample Location, and Location Risk > Combined—Combined includes Civil unrest, Terrorism, War, and Intelligence Events Heatmap, you view the following example.
The Map below shows the Action Panel open with the Layers Menu selected. Three locations are listed—Asset set 500, Refineries, and Sample Location. "Sample Location" is selected, and "Location Risk Combined" is selected. Red circles on the Map identify blue flags that represent location risk information for the locations included in "Sample Location."
Note: The flags are different colors when you select more than one location so that you can distinguish on the map which location has a risk marked by a flag.

Before we look closer at the indicator flags on the map, let's open My Locations from the Action Panel. Here we can see the contents of "Sample Location"—Montreal, Athens, Helsinki, Seoul, and Tokyo. The blue flags on the Map correspond with these locations. (When you have selected other locations on the Layers Menu, they appear as selectable tabs on the My Locations menu, and all of the flags for these locations are displayed on the map.)
We'll close the Action Panel to see the entire map and click the blue flags, which give risk information about the locations listed in "Sample Location."
For Montreal, the Location Risk Combined is 1.33. Civil Unrest is 1.61, Terrorism is 1.61, War is 0.78. The Lat Long are also listed: 45.558, 73.552.

The following example shows the information for Berlin.

The Layers Menu and My Locations menu show two locations selected—Refineries and Sample Location. The corresponding flags for those locations are green and orange.
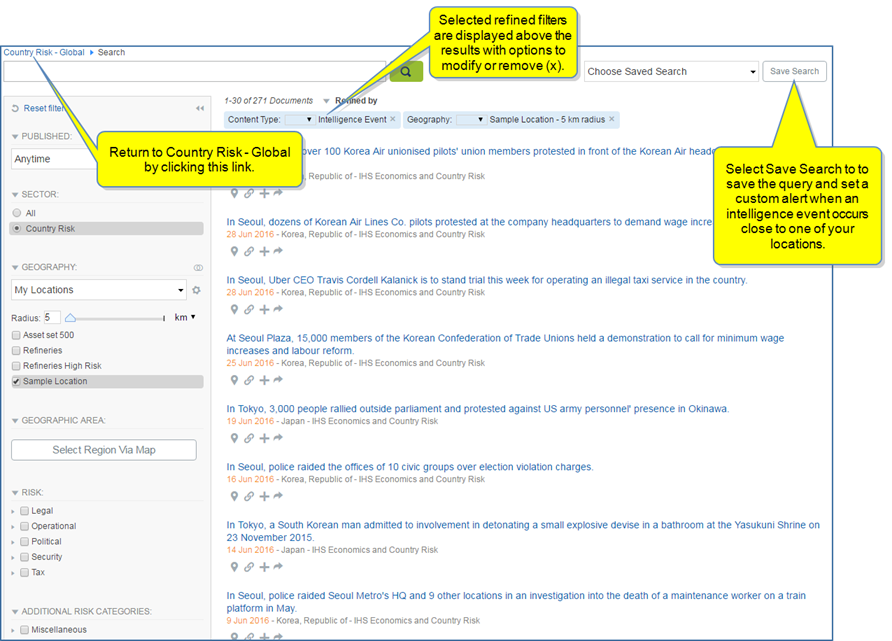
My Locations is available on the Search page under Refine Search Results when you select the Country Risk Sector. Under Geography, you can filter with IHS Regions, My Regions, or My Location.
The Upload Locations dialog opens when you select the gear icon next to My Locations.
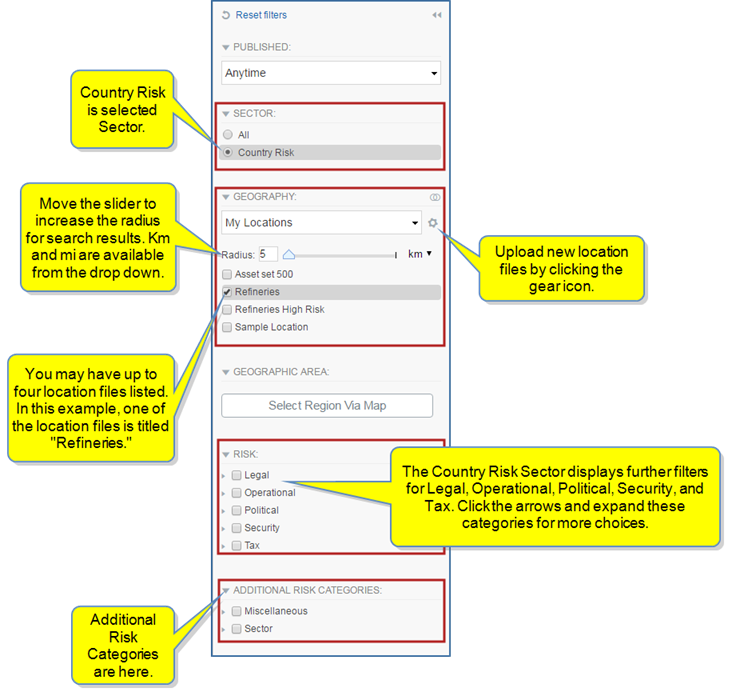
After selecting a location file, you can set the radius (km or miles) you want included as the margin around your location. The corresponding documents are displayed in the center of the page.
When you select the Gear icon  , the Upload Locations dialog box is displayed with links to View Upload Guide, Download Template file, and Download Sample file.
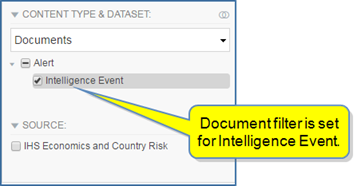
The Content Type & Dataset is filtered for Intelligence Event.
In the following example, we have come from a Country Risk - Global page to Search by selecting the search icon in the Search IHS Connect field. Therefore, the Search page is filtered for the Country Risk Sector. The locations included with Sample Location are London, Montreal, Berlin, Athens, Heisinki, Tokyo, Amsterdam, and Seoul. (Refer to Sample Location in the table format on My Connect / My Locations to view the names and other attributes of each location in the Sample Location file.) Note the search results list documents about these locations.