
The Dashboard page provides a workspace where you can design your workflow and dig deeper into the details of research for Country Risk, Economics, Energy, and Chemical domains on Connect. Open modules, which are content sets with a particular perspective and view of data, and arrange them in columns to meet your workflow needs. Manipulate the display of data within a module by using the various tools, icon buttons, and links provided on each module window. You'll find the Dashboard tool under the Tools tab.
The first time you open the Dashboard page, use the Create function to set up your first dashboard. When you subsequently return to the Dashboard page, your most recently viewed layout is displayed. You can then create a new dashboard, continue working on the current dashboard and save changes, bring up a saved dashboard, or discard a dashboard.
Dashboard subtopics:
A Dashboard brings together the information for the countries and companies you select on one page. Content type modules carry focused analytical and insight information in reports, research, editorials, charts, and data series. You can open and arrange the content type modules as you choose.
To create a Dashboard
From the Tools / Dashboard page, do the following:

 next to module names under My Modules, your subscription does not include the padlocked items.
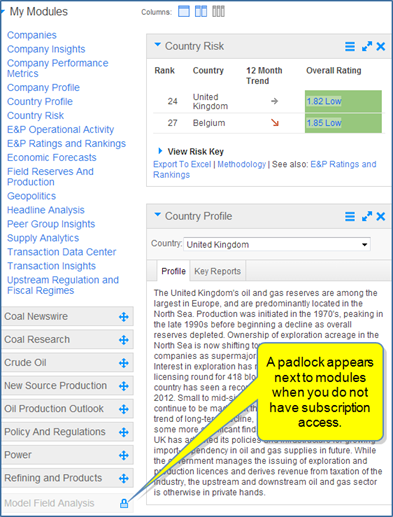


Once you've created a dashboard layout, you can save it on My Connect. By default, the Read Later project folder on My Connect contains My Dashboard. You can, however, save a dashboard with any name to any folder on My Saved. Once saved, it is available for selection on the Dashboard page.
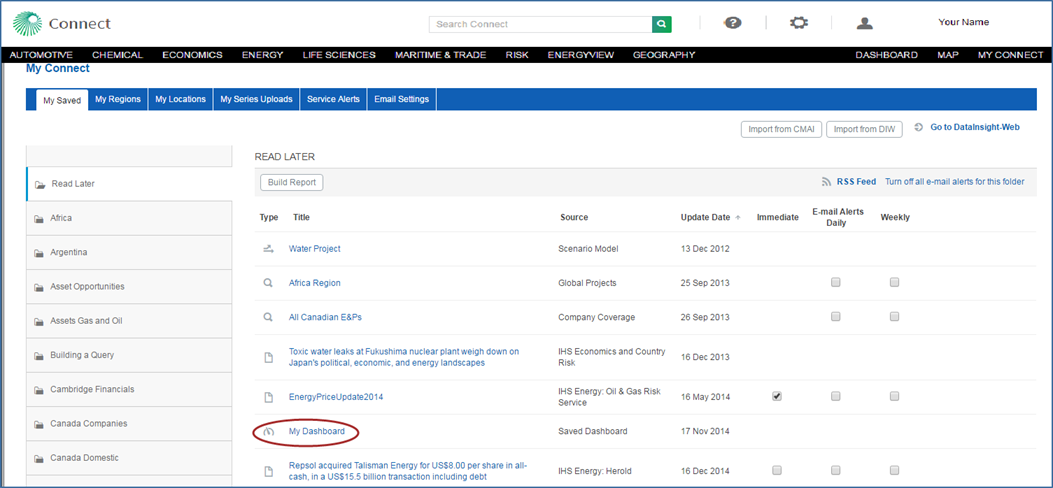
Note: You must use the saving options on the Dashboard page to save a dashboard layout to a folder on My Connect.
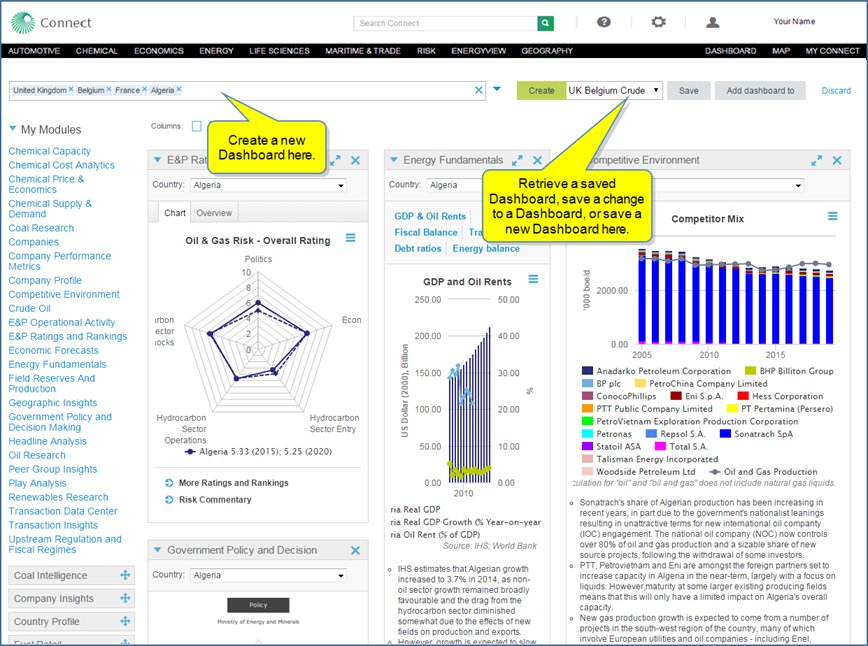
Let's focus on the options for saving or retrieving a dashboard by identifying the functionality of the save area on the Dashboard page.
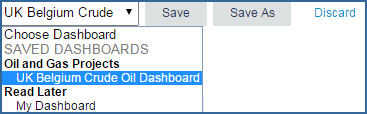
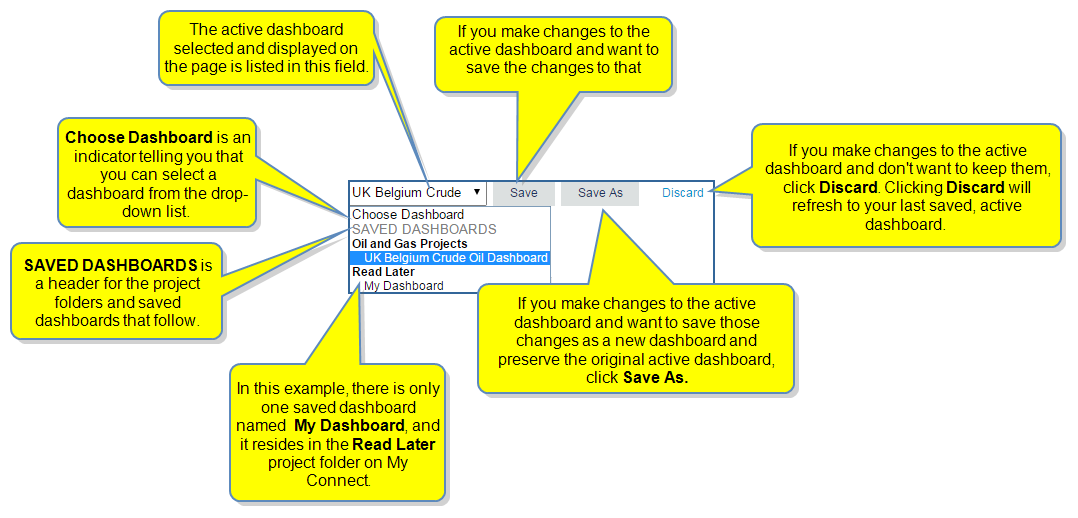
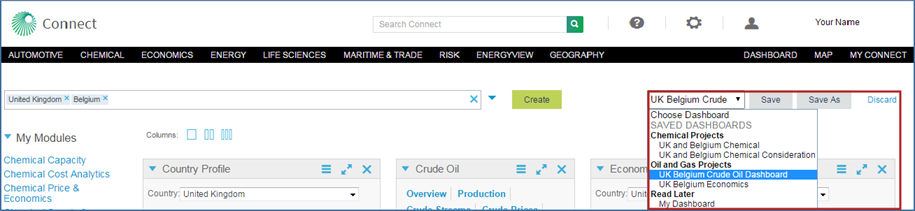
The save Dashboard area of the page contains UK Belgium Crude Oil Dashboard in the selected field with a drop down arrow.
In the drop down, Choose Dashboard is an indicator telling you that you can select a dashboard from the drop-down list.
SAVED DASHBOARDS is a header for the project folders and saved dashboards listed. The listed project folders and saved dashboards are stored on My Connect.
Also displayed are buttons for Save and Save As. Additionally, the Discard link is available for removing modifications to a dashboard.
To view the illustration, hover the mouse over the following graphic.
Let's explore the Save, Save As, and Discard functions.
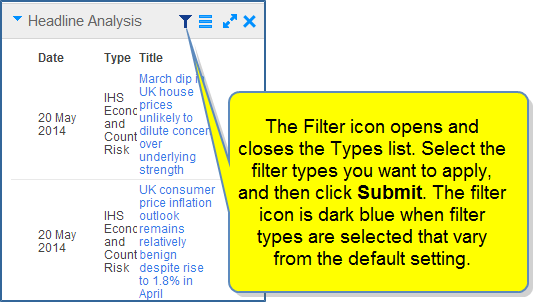
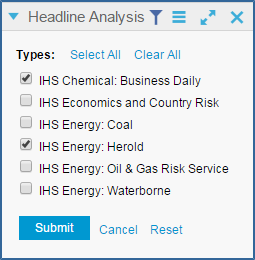
When you delete a module, add a module, apply a filter, or move a module to a different location, and then click Save, Connect displays,  .
.
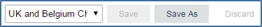
Note that the Save As button is active, but the Save button and the Discard link are grayed out. You do have the option to save this dashboard with a different name, but the save function does not apply because we have already saved the changes.
When you delete a module, add a module, apply a filter, or move a module to a different location, and then click Save As, a save dialog box is displayed.
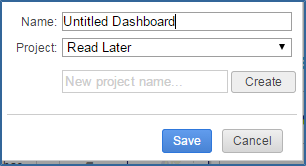
Let's name the dashboard "UK Belgium Economics" and place it in the Oil and Gas Projects project folder. We could create a New project name and create it as well, but in this example we'll select an existing project folder.
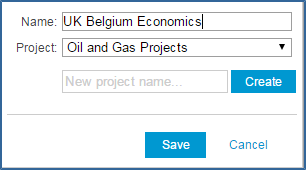
When we click Save, we again see the message, and find the new dashboard posted in the Oil and Gas Projects folder on My Saved. (To removed saved items from My Connect/ My Saved, see > Project Folder items.)

Now, the save dashboard area displays the UK Belgium Crude Oil dashboard as active, and we see it listed in the drop-down list under the Oil and Gas Projects folder. Save As is active, which means we can keep saving the dashboard with new names and to other folders.
When we delete a module, add a module, apply a filter, or move a module to a different location, and then click Discard, Connect displays  indicating the dashboard has been returned to your last saved selections.