Location Analytics is a tool in Connect that allows you to conduct risk analysis of a portfolio of locations previously uploaded to Connect using My Locations or Search. Once you identify asset locations and save the location groups, Location Analytics provides the context to analyze and compare violent risk conditions. You can chart information, create model scenarios, and view asset locations in a context with other map characteristics and assets. Once you create sophisticated scenario models, you can save them to My Connect and add them to Report Builder.
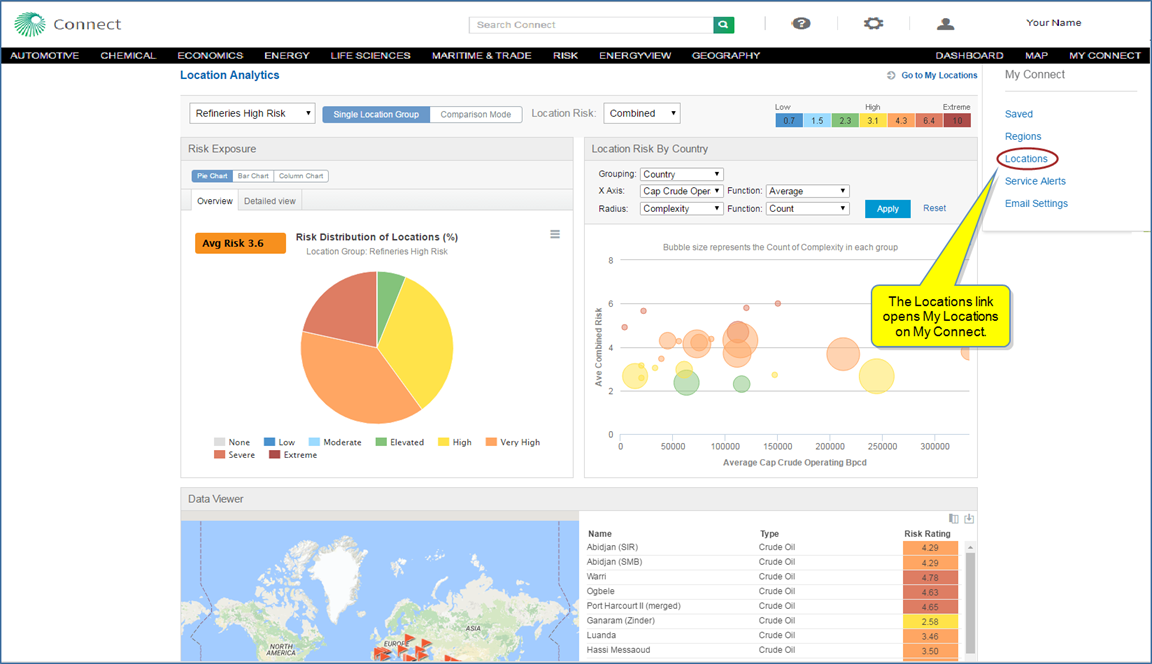
Note: My Locations is under the My Connect menu and houses the location group files where you can manage them by adding or deleting files, editing location files in table format, exporting them to .csv format, share with other colleagues, or access the map to use My Locations with risk indicator flags and details in a geographical view. See , My Locations, and Searching in Connect for more information.
You can manipulate and view data on three modules displayed on the Location Analytics page:
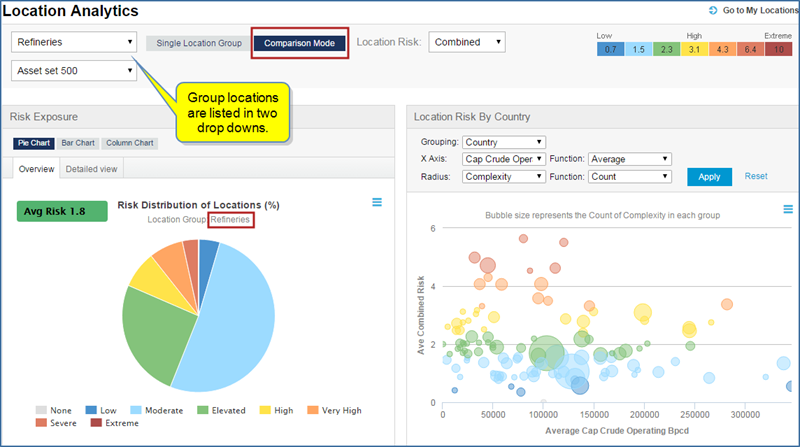
Above the modules are selections you can make to choose a location group, employ analysis with a Single Location Group or compare two location groups with Comparison Mode, and select a Location Risk—Combined, Civil Unrest, Terrorism, or War.
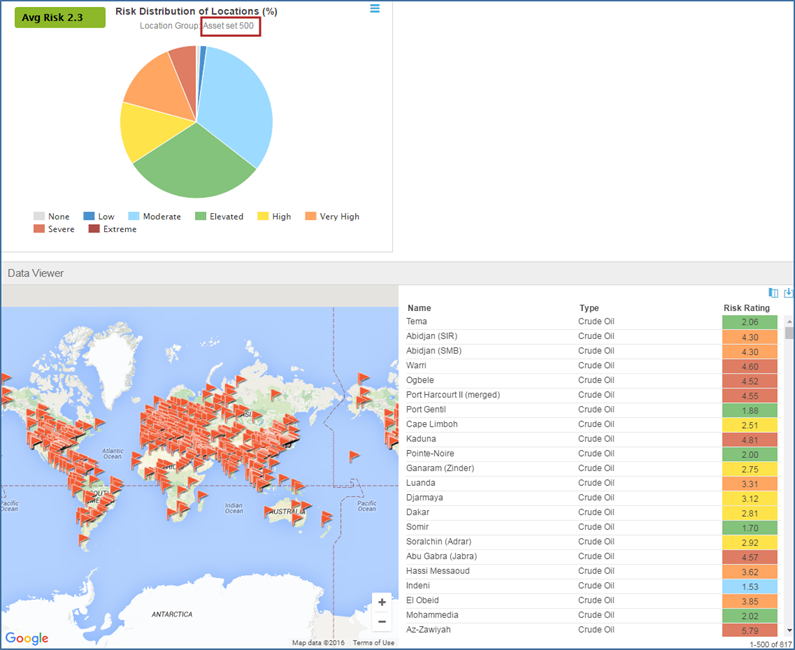
When you filter down into the charts contained in Risk Exposure, the Data Viewer module refreshes to display the sub group data. You can then, in Data Viewer, select the columns you want included in the table and save the filtered data as a new location group.
Location Risk By Country is a bubble map. Selecting options from the drop-down filters updates the bubble view after you click Apply. The bubbles are color-coded to reflect risk ratings, and when you hover over one, more detailed information is displayed.
Following are some examples of selecting view options and filtering data in the Risk Exposure, Location Risk By Country, and Data Viewer modules.
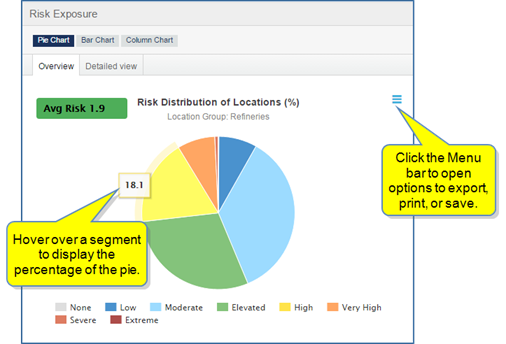
Risk Exposure provides an insightful entry point for analyzing risk distribution for the selected location group. The assets in your location group may be countries, refineries, buildings, or other assets you are tracking. In the following example, the location group is "Refineries." Reviewed as a Single Location Group for Civil Unrest  , the Pie Chart displays an Avg Risk of 1.9 and displays Low to Severe ratings in color-coded wedges of the pie. When you hover over a wedge, the percentage of the total refineries is displayed. When you click a wedge, the underlying location information for that segment is reflected in the Data Viewer map and table.
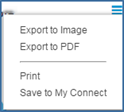
When you click the Menu bar, options to Export to Image, Export to PDF, Print, or Save to My Connect are displayed.

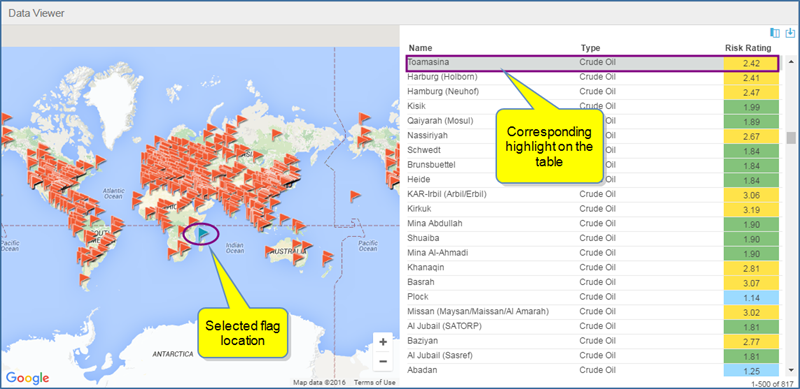
Note: When you select a location flag, the location name is highlighted on the table. Likewise, you can select a name from the table, and a blue flag reflects the location on the map.
You have the option to view a Bar Chart or Column Chart.


When you select the Detailed view, more segments of the pie, bar, and column charts are displayed.


Selecting a segment of the pie, bar, or column chart refreshes the Data Viewer so the map and table display the location information for that segment.


Select the Column icon  to open Select columns, drag and drop columns horizontally or vertically to establish selected columns and the order of display, and then click Apply changes.


Select the table save icon to save the subset as a new location group. The Save Filtered Results dialog opens. Enter a title and optional description, and then click Submit.
The new location group now appears in the Location Analytics drop down, My Connect, My Locations, Map, and Search.


The drop-down menus on the Location Risk By Country module allow you to filter results on the bubble map. Options reflect your selected Location Group file. The following continue the "Refineries" example.
Once you select filters, click Apply. The chart refreshes and you can hover over the bubbles for more detailed information.

When you select Comparison Mode, you can select two location groups and view results for both in Risk Exposure and Data Viewer.