The map provides a visual way to search for, review, and analyze information from the Chemical, Country Risk and Energy domains in a geographical context. You can search by location, key word, and / or any map layer.
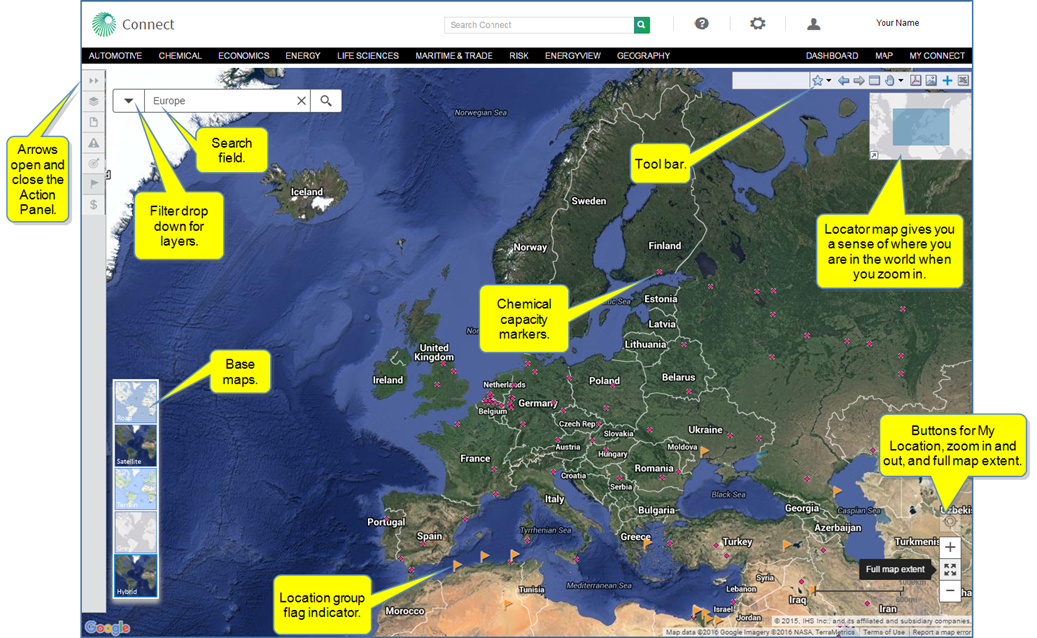
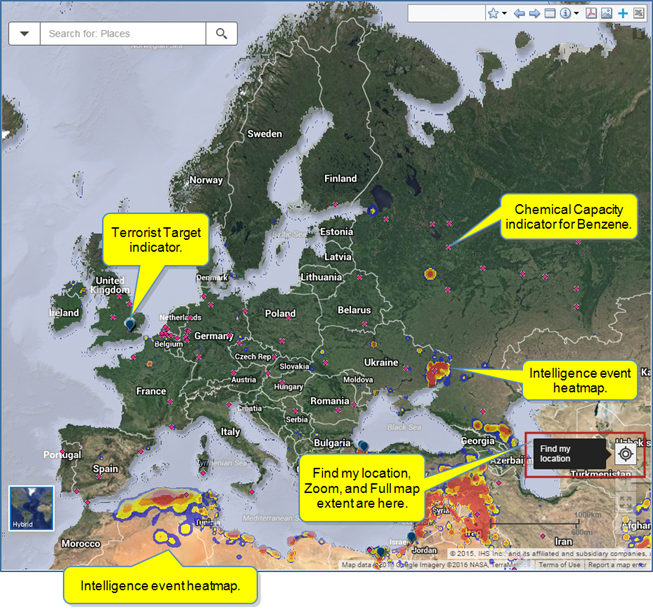
In the following map example, we have searched for Europe. The Action Panel is closed. The base maps are displayed in the lower left. My location and map extent with zoom appear in the lower right. The tool bar and locator map are in the upper right. Flags indicate a location group risk, and dark pink markers indicate chemical capacity markers. (With My Locations selected, the time slider is not displayed at the bottom of the map.)
The map contains several features for enhanced display and search capability. The paragraphs that follow provide more details about the features.
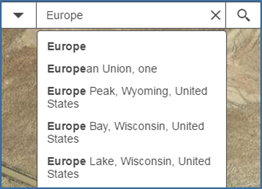
Use Search for: Places to enter a geographic location, company, or other keyword you want to locate on the map. The auto search gives you specific choices.
The drop-down list contains filters available per your subscription and can be used on the map and in conjunction with other choices from the Layers Menu.

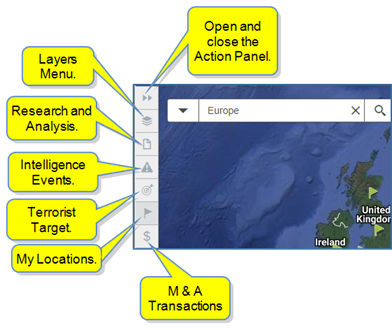
The Action Panel has five windows with an icon displayed on the Action Panel for easy selection.
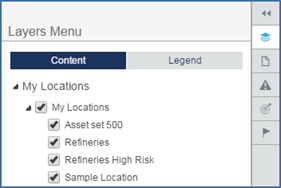
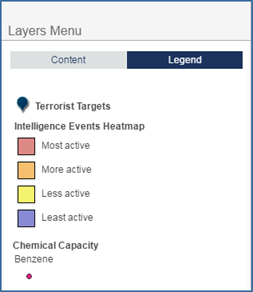
When you open the Action Panel, the Layers Menu becomes available, or you can select the Layers Menu with the icon. Check the content you want displayed on the map and view the Legend for the content indicators. In the Europe example, the layers content shows a location for Refineries High Risk and a Chemical Capacity for the chemical Benzene.
Note: The buttons and panels they open in the Action Panel are determined by your entitlements. For example, if you do not have access to Intelligence Events, you will not see the panel warning / button for Intelligence Events. In addition, if you have not uploaded location .csv files to My Locations, you will not see the My Locations flag / button.
Selecting Legends displays the icons used on the map for your layers selections. For Refineries High Risk location, the icon is an orange flag. For the Chemical Capacity Benzene, the icon is a dark pink circle.


Clicking a chemical marker, opens details about the chemical at that location. Selecting Browse the Data takes you to the Data Browser tool. Selecting Show Research displays the Research and Analysis information for this marker location.


When you select Location Risk, the following sub selections are available: Combined, Civil unrest, Terrorism, War, and Intelligence Events Heatmap. You can select one of these sub categories at a time. However, other layer selections such as Chemical Capacity and Midstream Essentials allow further selection of multiple sub selections.
The Location Risk / War selection displays a colored map that visually identifies extreme risk for war (red) to low risk (dark blue). Use the plus and minus signs to zoom in or out. Drag the map with the mouse to move it horizontally or vertically.
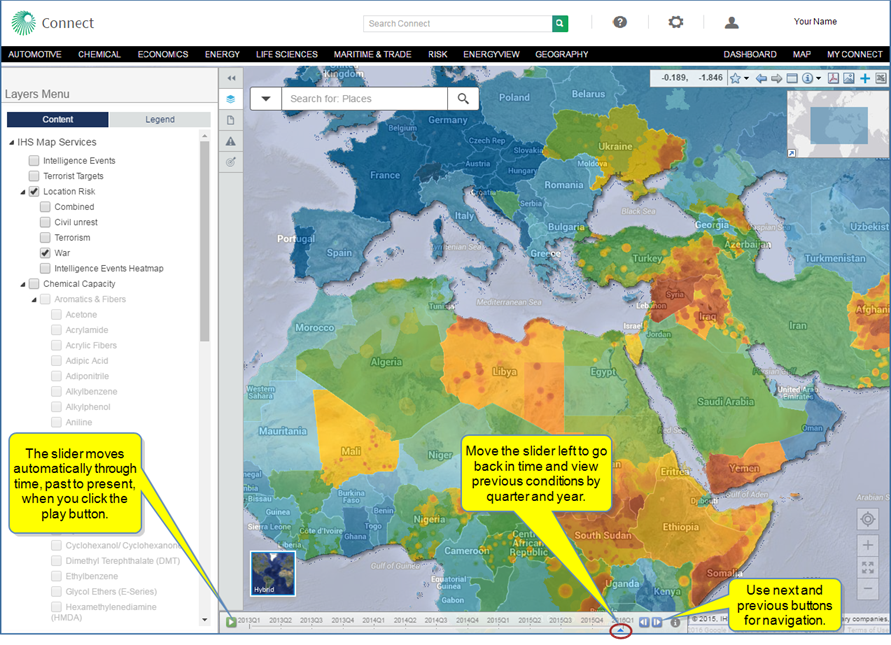
Note that the slider is available in all the sub selections for Location Risk with the exception of the Intelligence Events Heatmap.
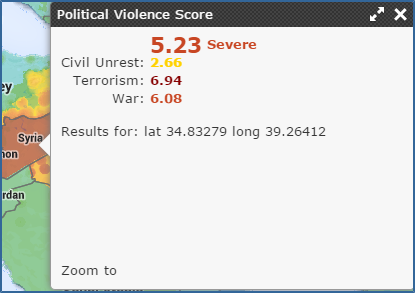
When you click a country, a Political Violence Score is displayed. The following example displays scores for Syria.
Note: Your subscription determines what layers are available to you.
Research and Analysis provides content information for All Content, Energy, or Chemical. You can refocus the search with a keyword. When you highlight research, the corresponding alphabetical marker is identified on the map so you see the location pertaining to the research. Likewise, when you select an alphabetical marker on the map, the article is highlighted in the Research and Analysis panel.
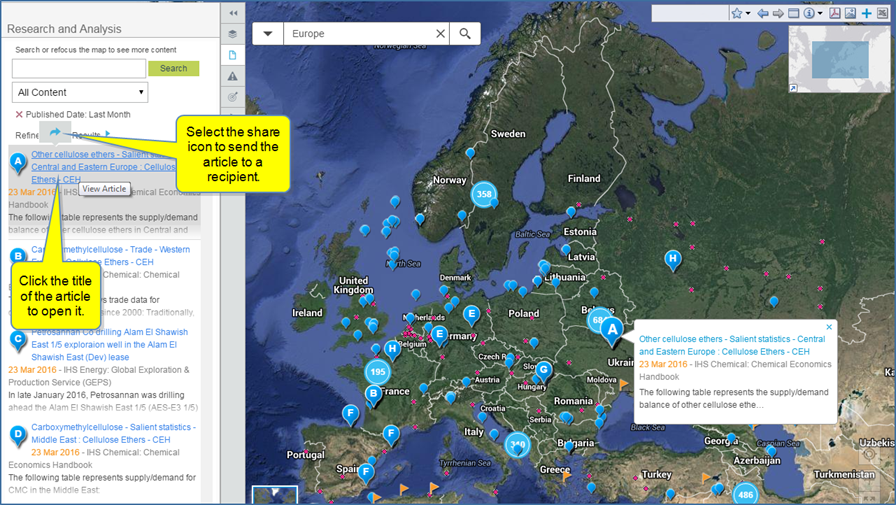
You can click a blue balloon using identify mode to display the details of the research, as well.
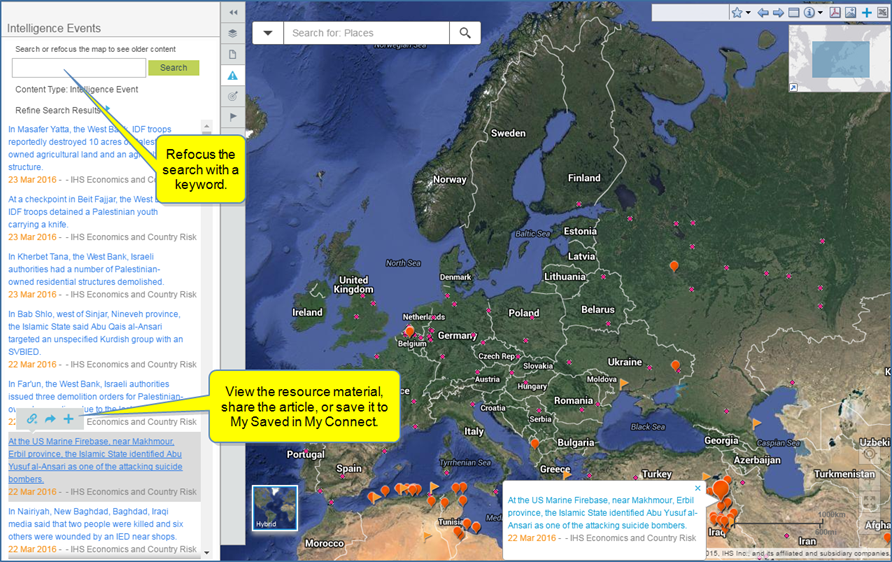
Intelligence Events lists pertinent articles for your location and identifies the research location on the map. You can review the resource material, share the article, or save it to My Saved in My Connect.
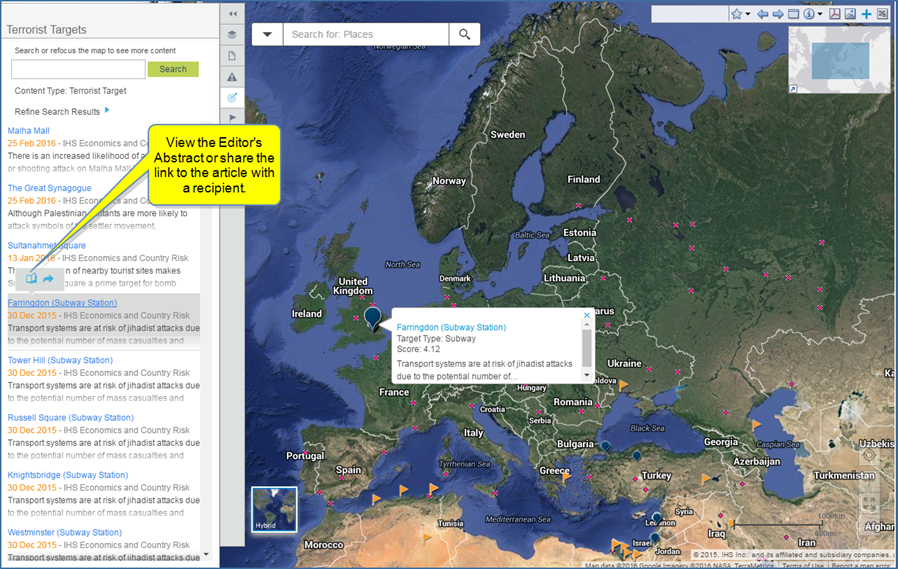
Terrorist Targets lists pertinent research for your location and identifies the research location on the map. In the example below, you can review an Editor's Abstract or share the link to the article.
My Locations reflects your selections from the Layers Menu. If all locations are selected on the Layers Menu, the locations are displayed on My Locations with tabs.
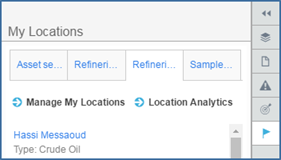
My Locations are available when you upload your own location information to track assets in particular locations. You can use the location groups to filter information displayed on the map. In this way, you can observe asset locations and country risk issues particular to the location.
The My Locations pane contains links to Manage My Locations and Location Analytics. To learn more about My Locations in My Connect, see and My Locations. To learn more about Location Analytics, review Location Analytics. Also review Searching in Connect for more information about research results using My Locations with a perimeter radius.
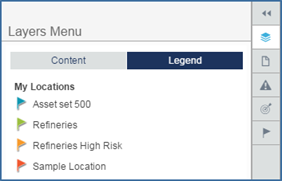
The Legend in Layers Menu displays the icon used on the map for a particular location.
Select a location group in My Locations, and then highlight an item on the list or a flag marker on the list to identify the location and review detailed risk information.
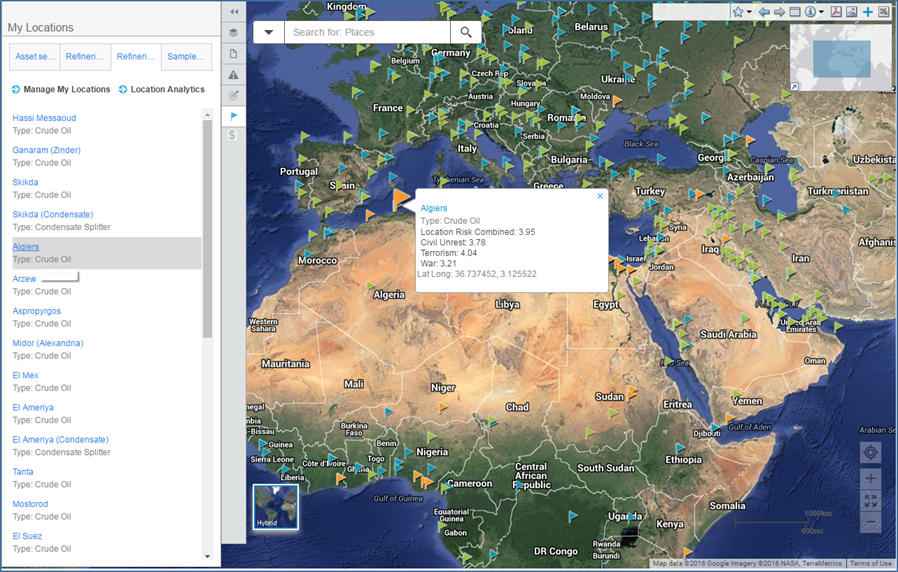
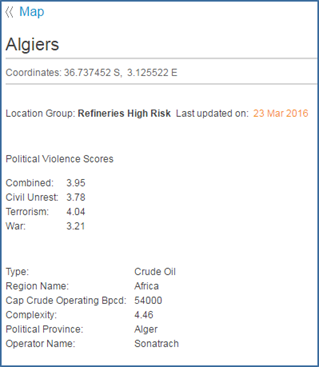
Click the link for Algiers in the above example to view detailed information, as well.
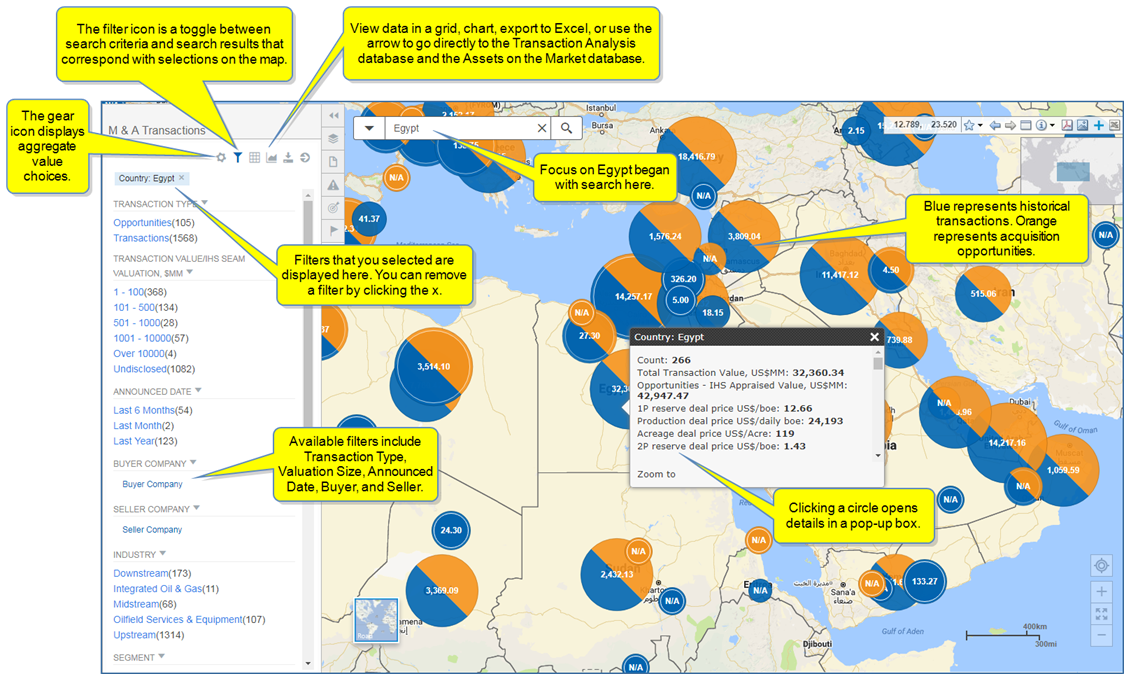
M and A Transactions provides a dynamic view and workflow opportunities for analyzing transaction trends with companies and regions—both historical transactions and current opportunities for acquisitions on the market. Connect pulls information on the map from the Assets on the Market database / tool and the Transaction Analysis database / tool. You have the ability to view transactions in the database tools and display them on the map. You can also navigate from the map to the database. Review Transaction Analysis and Assets on the Market for more information.
The filter pane allows you to refine your search criteria by transaction type, value, announced dates, buyer company, seller company, industry, deal level / opportunity level, and opportunity status. Icons function to select aggregate value, filter search results, view transactions and opportunities on a grid or chart, export data to Excel, and go directly to Transaction Analysis and Assets on the Market.
Circles on the map identity geographical locations and transaction / opportunity details, and the filter icon toggles between search criteria and search results that correspond to the plotted circles on the map. Workflows can include identifying companies' sales or future sales, company transactions as buyer and seller, and more complicated scenarios to identify trends—for example, identifying where a company has been divesting assets and where they are buying assets. Your trend analysis can be company focused and / or regional.
In the following example, we searched for Egypt. The blue on the circles represents historical transactions. The orange represents acquisition opportunities. Clicking the bubble displays detailed information in a pop-up box.
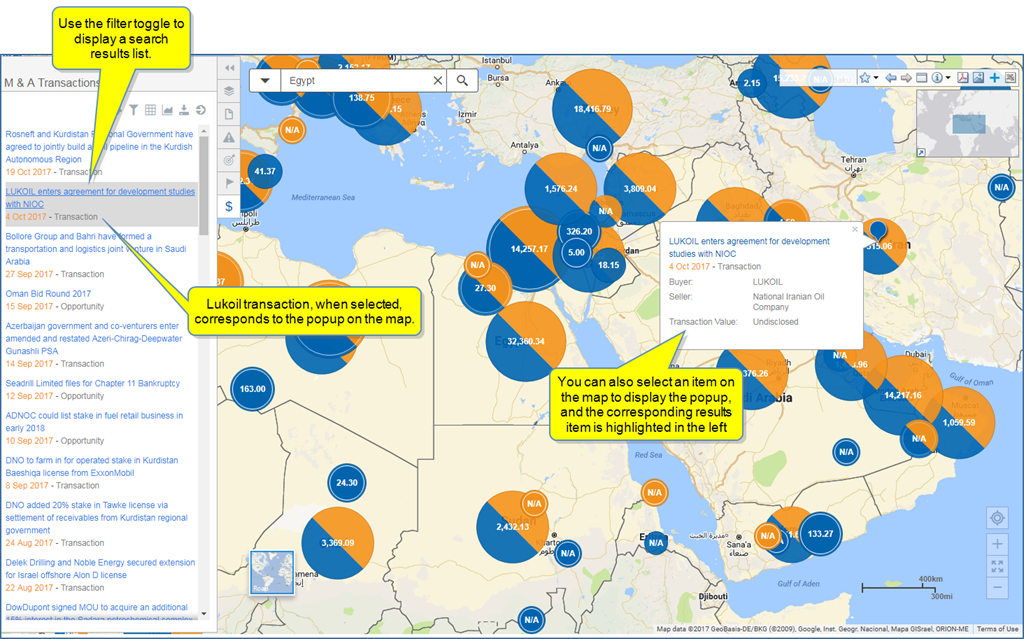
The filter pane presents filter options, including buyer and seller selections. The filter icon toggles between filter options and search results that correspond to the circles on the map.
Clicking the filter icon displays search results in the left pane that corresponds to areas on the map. Select an item from the list to view the corresponding location on the map. You can also click a circle on the map to highlight in item on the results list.
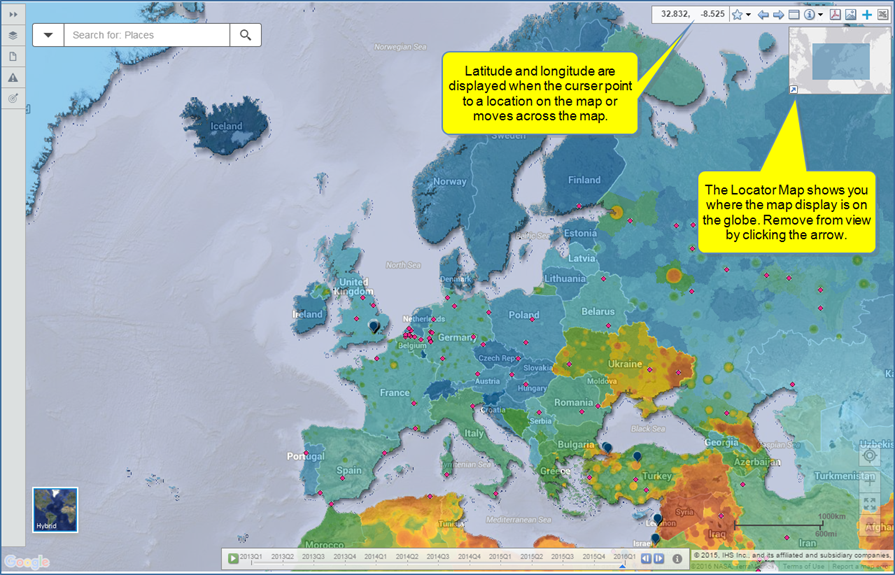
The Tool Bar and Locator Map are displayed in the upper right. The latitude and longitude are displayed on the Tool Bar when you point the curser to a location on the map or move the curser over the map.
The Locator Map shows you what part of the world is displayed on the map. You can remove it from view by clicking the arrow. To expand a hidden Locator Map, click the Show Locator Map icon.

The icons on the Tool Bar give you access to the following functions listed in the table below.

|
Click the down arrow next to the star to add a bookmark.  |

|
Move between map extents—your previous views |

|
Toggle to full screen |

|
Click the down arrow next to one of these icons to view two more icons: use the  icon to select an area of data for export to Excel ( icon to select an area of data for export to Excel ( ); select the ); select the  icon to reposition the map within the window or select a feature; or select icon to reposition the map within the window or select a feature; or select  to enable the identify mode. to enable the identify mode. |

|
Export to PDF |

|
Export to image |

|
Add to My Saved |

|
Export to Excel. After you select an area of data on the map using the icon, select the Export to Excel icon. |
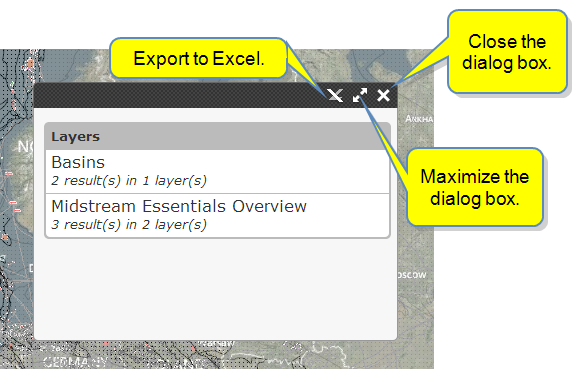
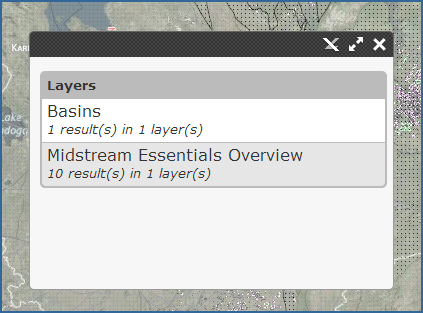
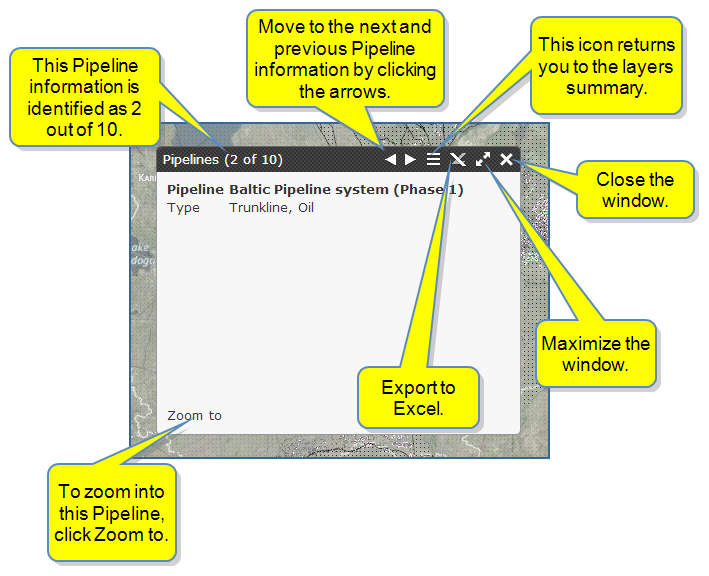
With Identify mode, click a result to access summary location information. If the result has multiple Layers (in this example, Basins and Fields), Connect indicates the number you can review.
When you move your mouse over an item, it is highlighted. Click it to display a list of the results.
As you select more items, more detail is displayed.
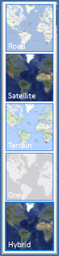
You have five map view choices:
When you select a map, the others collapse, and only your selected map is displayed. To change maps, click the one displayed to view all five maps. Again, when you select one, the others collapse.
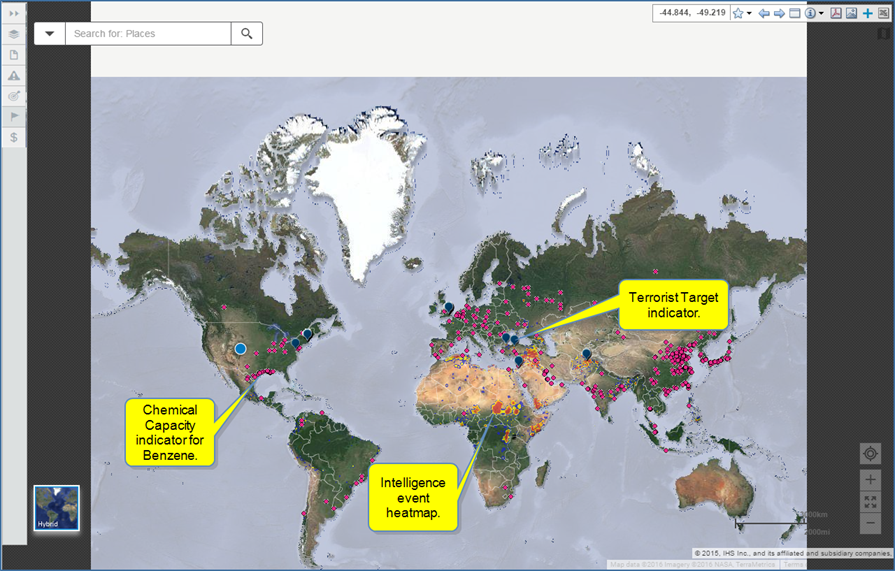
In the right lower portion of the map, button icons map your present location, zoom out and in to the map, and display a full map extent view. Notice Chemical Capacity indicators for Benzene, Terrorist Targets indicators, and Intelligence event heatmap indicators.
The corresponding Layers Menu shows Terrorist Targets, Location Risk > Intelligence Events Heatmap, Chemical Capacity > Aromatics & Fibers > Benzene selected, and the Legend panel identifies the icons used for these selections shown on the map.

The first time you use Find my location, the browser asks you to allow tracking of your physical location.

You can Allow once, or select options to Always allow, or Always deny and don't tell me. Once you allow, Find my location works and any messages like, "We cannot find your coordinates," resolve.
Here is an example of Find my location. By clicking the button, the map went from Europe to a US location.
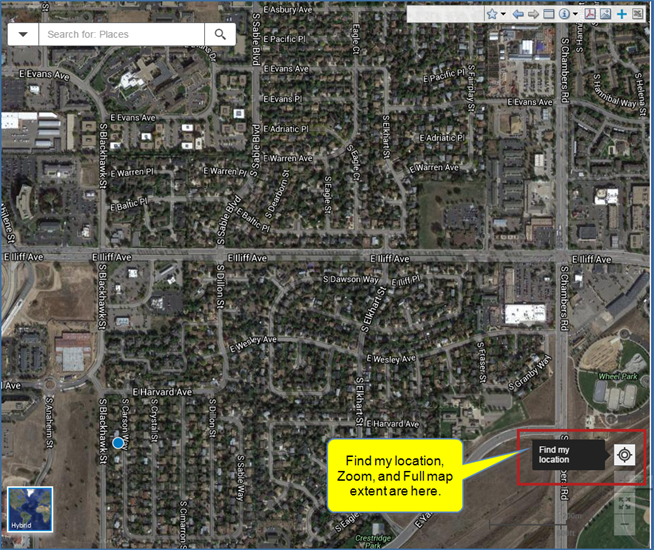
By using the Previous extent in the Tool Bar  , we can return to the map of Europe.
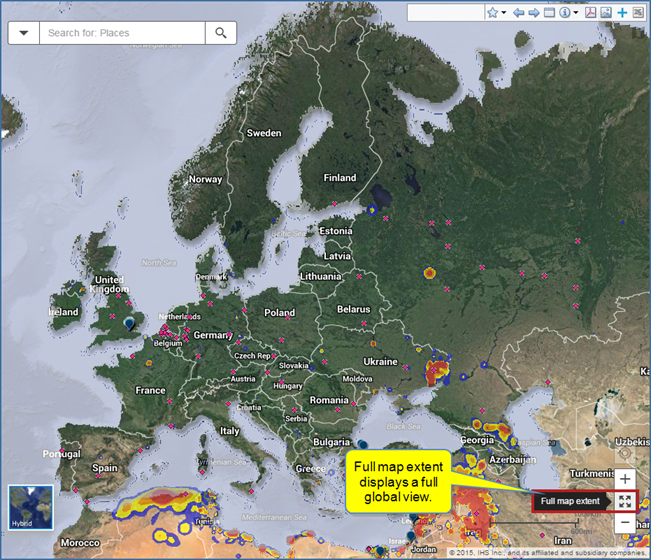
A Full map extent view is global. Notice Chemical Capacity indicators for Benzene, Terrorist Targets indicators, and Intelligence event heatmap indicators.